Simplify how you work
Secure collaboration with anyone, anywhere, on any device
Trusted by the world's leading organizations
Frictionless security
Protecting your sensitive files is a top priority. That's why we bring you advanced security controls, intelligent threat detection, and complete information governance. But since your needs don’t stop there, we also offer strict data privacy, data residency, and industry compliance.
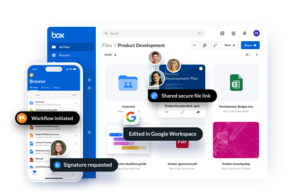
Seamless collaboration
Your business depends on collaboration between lots of people, from teams and customers to partners and vendors. The Content Cloud gives everyone one place to work together on your most important content — and you get peace of mind that it's all secure.
Powerful e-signatures
Sales contracts, offer letters, vendor agreements: Content like this is at the heart of business processes, and more and more processes are going digital. With Box Sign, natively integrated e-signatures included in your Box plan, you get a cost-effective way to power your business.
Simplified workflow
Manual, cumbersome processes waste hours each day. So we let anyone automate the repeatable workflows that are key to your business, like HR onboarding and contract management. Workflows move faster, and you focus on what matters most. It's a win-win.
1,500+ app integrations
With the Content Cloud, you get a single, secure platform for all your content — no matter where it’s created, accessed, shared, or saved. More than 1,500 seamless integrations mean teams can work the way they want without sacrificing security or manageability.
Put AI to work, securely
Bring the best of AI-powered content management to your data, and empower teams with insights that boost productivity. Get answers from your largest documents, create content in seconds, and make mission-critical decisions faster. And do it all while maintaining Box’s enterprise-grade security, compliance, and privacy standards.

Open platform
With open APIs, first-party SDKs, integrated developer tools, and rich documentation, you can customize and extend Box to suit your business needs. Automate key workloads, customize your Box experience, and securely connect your business apps.

Content migration
Accelerate your move to the Content Cloud with Box Shuttle, our market-leading content migration tool. It’s fast, easy to use, and cost-effective. Best of all, it’s built with the full power and security of Box, so you can get more from your content.

Admin controls
User management is simple with Box. Intelligent monitoring and reporting tools give you a bird’s-eye view of how content is being shared and accessed across your organization. You get full visibility and control, and your teams get more done.
At FICO, we want to maximize on our global talent and provide them with the tools to do their jobs better together. Box is helping us connect the dots from region to region and from device to device.
– Tony McGivern, CIO
Box has become the industry standard in this space and we’ve chosen it to continue our drive toward efficiency, security, and simplicity for all our employees.
– David Smoley, CIO
By investing in a cloud content management platform like Box and leveraging other best-of-breed technology partners, we have been able to create a more secure, efficient and collaborative environment for conducting business.
– CDO, Morgan Stanley Wealth Management
Box fits the ‘3S-3C’ model: Simplicity, scalability, and security. Cloud-based, clean desks, and current.
– Andy Nallappan, Vice President and CIO